Model team experience as system evidence
Every team has synthetic signals across flow efficiency, delivery reliability, developer experience, platform enablement, operational load, and learning health.
Turn engineering friction into visible leadership decisions.
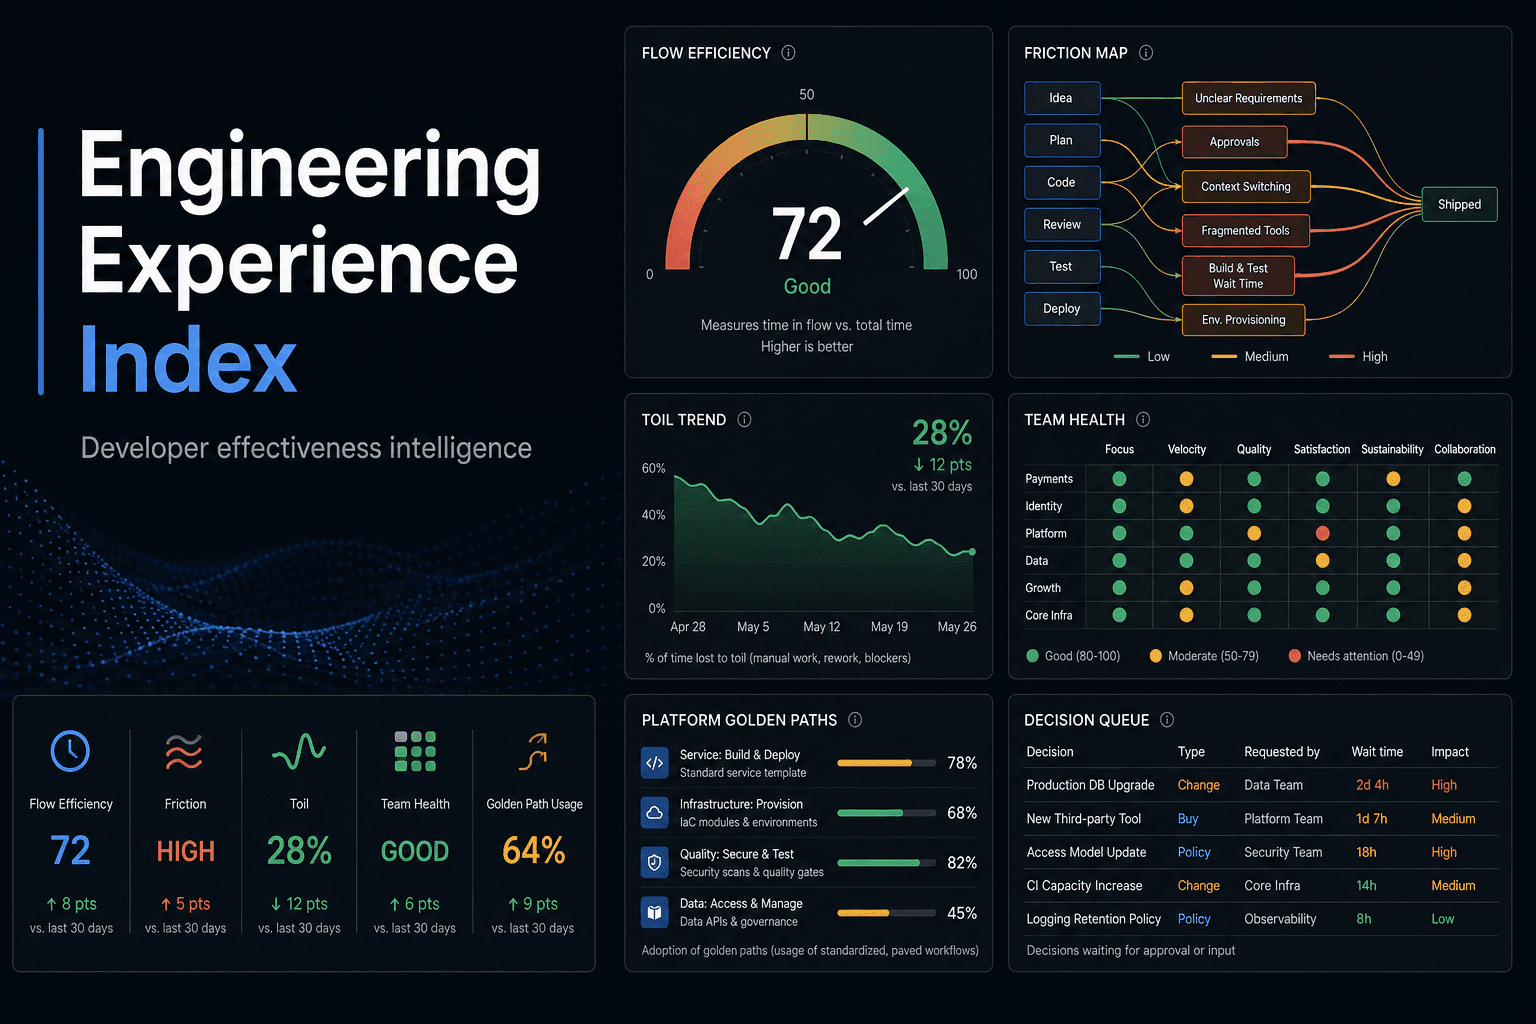
Delivery dashboards often focus on output, dates, and status. They can miss the operating conditions that determine whether teams can deliver sustainably: cognitive load, slow build loops, excessive operational toil, unclear ownership, onboarding drag, platform gaps, and recurring blocked dependencies.
Every team has synthetic signals across flow efficiency, delivery reliability, developer experience, platform enablement, operational load, and learning health.
The index combines weighted dimensions with explainable drivers, making it clear why a team is thriving, healthy, strained, or in need of intervention.
Missing ownership, stale evidence, high incident load, burnout signals, blocked dependencies, and slow build loops cannot hide behind a healthy average.
The system turns friction patterns into recommended actions: reduce toil, fund platform improvements, unblock dependencies, clarify ownership, or reset delivery capacity.
Illustrative enterprise evidence model: Jira · GitHub · CI/CD pipelines · incident systems · internal developer portals · engineering surveys · onboarding metrics · platform telemetry · DORA-like signals. The public demo uses synthetic data, no API keys, and no employer connections.
The application demonstrates how a senior technology program leader can connect engineering effectiveness, platform investment, operational resilience, and talent sustainability into a single executive decision model.